
This version is optimised for teaching ARM code and a number of the features and some of the terminology used here is ARM specific. KMD is not intended to be ARM specific, but expediency has forced development in that direction.
KMD and its associated software has been developed for teaching purposes in the School of Computer Science at the University of Manchester.

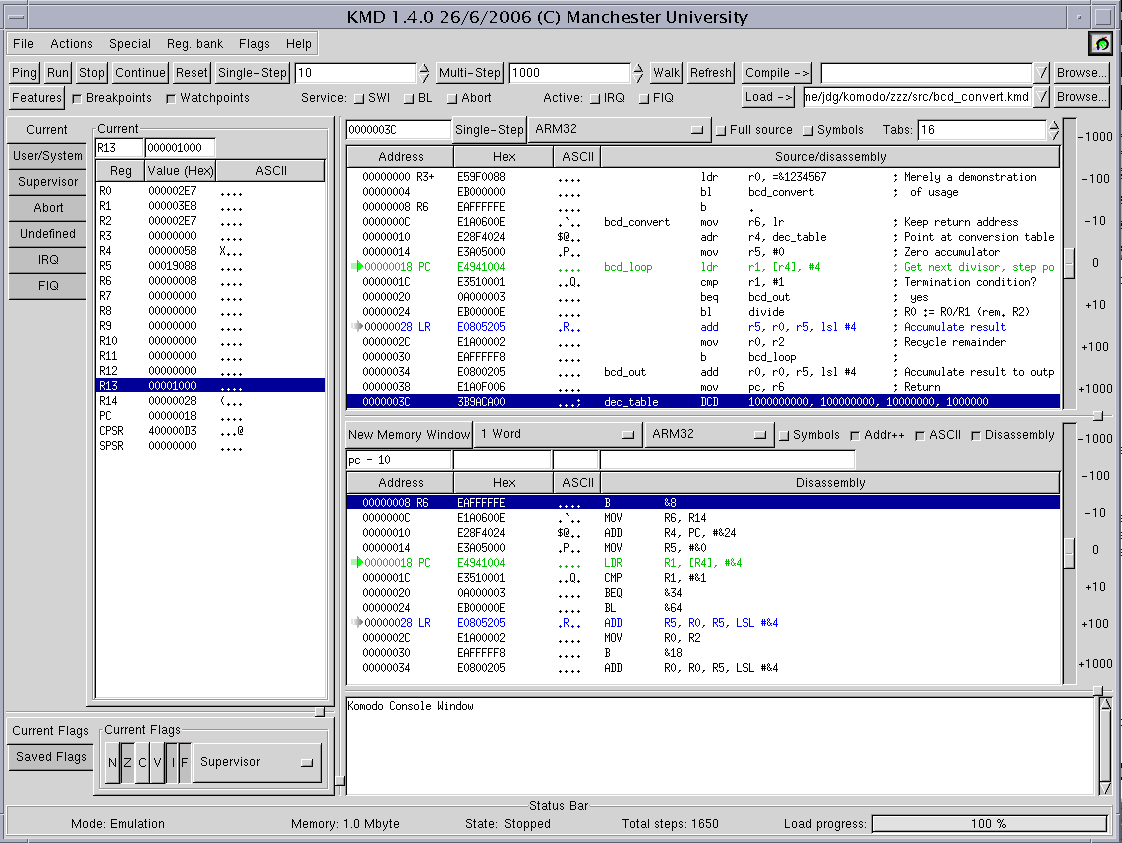
The main window is the feature which appears when KMD is started. It contains a menu bar, some global control features and a view of the target system's state. The panels are customisable at startup and are specified in the ".kmd" configuration file.
The menu bar largely contains duplicate functions for some of the features below. There are a few additional unique options in here, such as the ability to open a symbol table view, but these are self explanatory.
Run starts execution on the target system at the current PC value.
Stop stops execution on the target system.
Continue continues execution on the target system in the same manner as previous.
Reset performs the equivalent of a hardware reset on the target processor, leaving execution stopped. It does not reset the rest of the target system so peripherals et alia will not be reinitialised.
Single-Step executes one instruction on the target system.
Multi-Step executes several instructions on the target system; the number of instructions is controlled by the box to the left which can be changed with the little triangles or typed directly (followed by <return>).
Walk executes multi-steps every X ms (where X is specified in the box to its left). [The top speed may be limited by the speed of the target, the communications speed, etc.] Walk is terminated as appropriate by active breakpoints, et al.
Refresh controls the updating of any target state views. When
active, snapshots of the register and memory state are taken
periodically and displayed in any active panels. If inactive the
displays are not updated.
Refresh is activated automatically when target programmes are run, and
deactivated when they stop. However manual override is sometimes
desirable. For example:
Target execution can be speeded up and made more deterministic by not interrupting it to repeatedly dump memory state.
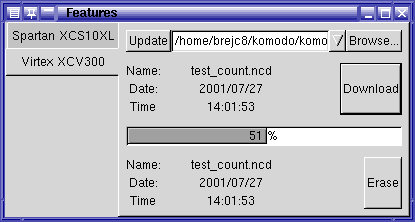
Features invokes a window which contains any `special' features provided by the target system. These are described elsewhere.
The Breakpoints `check box' globally enables any breakpoints which may have been set. Breakpoints are described in detail elsewhere. The global disable of breakpoints may make the target system run faster.
The Watchpoints `check box' is similar to the Breakpoints feature. Watchpoints are described elsewhere.
There is the ability to Service various events without
explicitly stepping through them. These events are {System calls (SWI),
subroutine calls (BL) and Aborts}. If these options are enabled these
calls are treated as single steps.
The interpretation of what constitutes a subroutine call (et al.) is
left to the target system. However in general the call will end when
the return address is reached with the stack and mode in the initial
configuration; this allows recursive calls to be stepped. Note that
it is possible that an ill-behaved `call' does not complete in this
way.
The various interrupts {IRQ, FIQ} can be set Active. In these cases the interrupts are abstracted and will be serviced even when the foreground code is stopped. This is an aid to debugging when it is necessary to have interrupts serviced in real time.
Load loads a previously prepared memory image. At present three formats are accepted:
In the first two cases any available symbols will also be loaded and can be displayed.
Register names can be changed or aliased in the .kmd configuration file. There may be more than one name for a register: for example ARM R14 may also be referred to as "LR" and these are accepted.
The value entered can be an expression, which can include register names and symbols if a symbol table is loaded. This last case makes it easy to initialise memory pointers by hand.
The processor's flags and mode are echoed onto a separate panel below, for ease of reading and alteration. In the case of a flag button, pressed = '1'. The `saved' flags in the SPSR are also available in this way.
Other colouring is used for highlighting. Addresses pointed to by certain registers are coloured: the PC is green, the LR is blue and the SP is purple. (These can be changed in the .kmd configuration file). Active (single location) breakpoints are orange.
The source window's origin is held in the entry box above the address label. This accepts an expression: for example a particulary useful setting would be something like "PC - 10", which scrolls a window to follow execution.
By default, only source code lines which resulted in output values are included. The Full source button allows all the lines to be displayed, although this can often swamp what is intended to be seen.
The Symbols option replaces the address in the display with a symbol from the symbol table if one is appropriate.
Tabs simply controls the mnemonic position for the disassembler; this can be set so the disassembly matches the author's source code preference.
The main panel displays the address (or label), data value, ASCII equivalent and source code line (actually list file line from the imported file). All values are in hexadecimal. A scroll bar allows the window origin to be moved, temporarily cancelling the entered value.
Other source file panels can be opened in separate windows using the pull down menu from the menu bar.
In the first two formats, several options for the number of values per line are available via a selection menu.
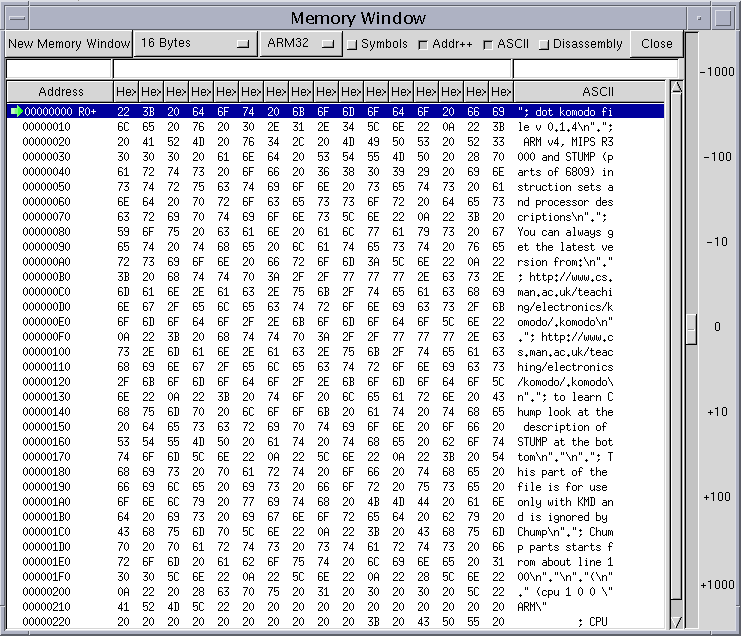
Memory may be modified by selecting an entry and typing a new value in either the hex or ASCII entry box: hex entry will accept expressions; ASCII entry will accept several consecutive values (i.e. a string). In all cases the address will step on if the Addr++ box is selected. (This is useful for editing memory but should normally be deselected for changing I/O ports.)
Entering valid instructions in the Disassembly entry box will generate the appropriate instructions.
The address can be replaced by a symbol, if available, by checking the Symbols option. Only one symbol (value) per address is displayed. The address column is annotated with a register identifier if a register points at that address; if more than one register shares a value, one is used and suffixed '+' to indicate that several registers point here. Colour coding for certain other functions is also used and is the same as in the Source Panel described above.
Other memory panels can be opened in separate windows using the pull down menu from the menu bar or the New Memory Window button on an existing memory panel.
The Load bar simply indicates the completion state of a memory load operation.

As many additional memory (or source code) windows as required may be invoked. It is often convenient to use a hex dump for global memory space and, perhaps, another to follow the stack.
These windows contain panels which are identical to those used for the main KMD window.

Breakpoints can be used in various ways in KMD. The simplest method of setting (or clearing) a breakpoint is to double-click on the appropriate memory location. (The location will be highlighted in orange in the memory window(s).)
If a breakpoint is encountered during a code fetch it causes programme execution to be suspended before the instruction changes any system state. The exception to this rule is if the instruction is the first one fetched, in which case it is ignored: this allows a Run or Continue to proceed after encountering a previous breakpoint.
All breakpoints are enabled/disabled by the Breakpoints check box in the main window. Disabling any breakpoint checking can speed up the back-end code.
Individual breakpoints can be disabled from a pop-up window. Under Special on the menu bar either the Breakpoints or the Simple Breakpoints dialogue can be displayed. Breakpoints can be entered via these. By selecting a breakpoint it can be deleted or deactivated with the appropriate button. An inactive breakpoint has no effect on execution, but the value is retained to make it easy to reactivate if required.
Simple Breakpoints are just breakpoints at a single address. However full Breakpoints can specify much more. There are two fields associated with the address of a breakpoint and these can be used in two different ways. The first approach is referred to as Mask: this masks the address with one value ("Address B") before performing the comparison with the other address ("Address A"). This allows, for example, a single breakpoint to cover a `page' of memory. A similar facility is possible in the data field. Thus, for example, it is possible to mask out the entire address field and some of the data bits and compare with a remaining pattern, giving the ability to break on a particular class of instruction or a chosen register reference.
The other way of using the address and data fields is designated <X<; this sets two (inclusive) limits between which a breakpoint is activated. This is probably most useful as a form of debugging memory protection, covering (supposedly) unused areas of memory.
There are also some options on whether the breakpoint is active for User or Kernel modes, and some options as to transfer size and direction. The latter are not terribly useful in setting breakpoints but are used when setting watchpoints.
Watchpoints are similar to breakpoints except they occur on data transfers rather than code fetches. Their control from KMD is similar, except there is no simple `double click' option.
There is a maximum number of breakpoints and watchpoints which depends on the target system.

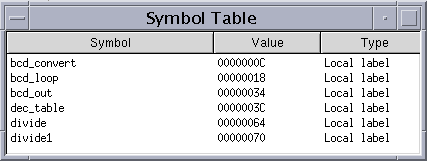
If a KMD or ELF file which includes a symbol table is loaded, these symbols are stored internally. They can be displayed in a Symbol Window, available from the Special menu bar entry.
Symbols can be annotated onto the source or memory panels, although only one value is chosen if several overlap.
Any symbol can be used in expressions. This is particularly useful when trying to locate named memory locations, for example, as the name can be used, rather than the address.
Some labels are not included in the symbol table: the loader filters out what are apparently compiler generated `names' (such as null strings) in an attempt to keep the display readable and uncluttered.
Unary operators are '+', '-' and '~'; the last performs a NOT operation.
Binary operators, in order of decreasing precedence are:
| Symbol(s) | Function | Precedence |
| << | Left shift | 5 |
| >> | Right shift | 5 |
| & and | AND | 4 |
| | or | OR | 3 |
| ^ xor eor | exclusiveOR | 3 |
| * | Multiply | 2 |
| / | Divide | 2 |
| + | Add | 1 |
| - | Subtract | 1 |
The default name for the script is "kmd_compile". This will be searched for in the directory specified by the environment variable KMD_HOME (if it exists); if not KMD will try to establish its binary's directory and look in there instead.
The default name can be overridden in the .komodo configuration file using the "compile-script" directive.
Below is an example of a "kmd_compile" compilation script which passes the specified source file (say "file.s") to an assembler ("aasm") which generates a list file in kmd format called "file.kmd".
#!/usr/local/bin/bash
KOMODO_HOME=/home/cadtools/komodo
FLNME=`echo $1 | sed s/[.]s$//`
$KOMODO_HOME/aasm -lk ${FLNME}.kmd $1
Clearly more sophisticated compilation and linking (such as a `make')
could be included here.
ELF is a standard Unix format and is produced by most compilers and assemblers. Details are widely available.
KMD is a proprietary format intended for easy loading of list files. It is entirely ASCII based and a description is available.
If the file format is not recognised, kmd will load it as unformatted binary. A single load address must be entered and the file is loaded incrementally from that address.

Application specific features are supported. The number and type of features which are present are defined by the target system. Here a window is used to download bitfiles to a remote FPGA which acts as a programmable peripheral device. Clearly this feature is only available on a physical realisation.
Note that the character streams are buffered to some extent, but that the terminal can be `deactivated', potentially causing an output SWI to stall.
kmd -s /dev/ttyS1
Alternatively the target can be an local emulator; this is a separate
programme and is invoked
with the option -e. The default emulator is called
"jimulator"; another emulator can be specified after the "-e", thus:
kmd -e my_emulator
The default configuration file is called .komodo and is in your HOME directory. An alternative configuration can be specified with the -k option:
kmd -k my_config
If a .komodo file is not explicitly specified, kmd will warn of the
omission and use the internal file.By invoking kmd with the -c option the internal file can be copied into your HOME directory; this can be a useful starting point for further customisation.